

You’d be hard pressed to find a state or utility that hasn’t experienced rate inflation to some degree over the past several years. Across the U.S., and internationally too, we’ve seen steady electricity rate increases driven by factors like rising fuel costs, policy changes, infrastructure investments, population growth, and data center developments. Nowhere are rising electricity costs more evident than in Hawaii, where residents face some of the highest rates in the nation.
We’ve been tracking Hawaii rates in ETB Developer since 2014, and we often get the question from our users and developers: How much have Hawaii rates increased over time? This is a question we answered for the California market with our Definitive Guide on Electricity Bill Inflation in California, and we recognize the lack of a similar analysis of the Hawaii market. And with a base rate increase anticipated to go into effect in 2026 for Hawaii utilities, now is a good time to look at the annual cost trajectory for Hawaii rates over the years. Let’s look back at the last 10 years of utility rate data for commercial and industrial customers located in Oahu, Hawaii, and Maui to see how rates have inflated over time.
Rate Schedules in Hawaii
Hawaii electricity rate schedules are made up of the base energy rates that are set periodically through formal rate case proceedings with the Hawaii Public Utilities Commission, plus riders and adjustments like the fuel adjustment and energy cost recovery surcharge.
Our analysis focused on three specific rate schedules: G, J, and P. Schedule G is a small business rate schedule for customers with loads less than or equal to 5,000 kilowatt-hours per month and less than or equal to 25 kilowatts; Schedule J is a medium business rate schedule for customers with loads exceeding 5,000 kilowatt-hours per month but less than 300 kilowatts; and Schedule P is a large business rate schedule for customers with loads equal to or greater than 300 kilowatts.
We’ll be looking at Hawaiian Electric Company for Oahu, Hawaii Electric Light Company for the island of Hawaii, and Maui Electric Company for the island of Maui. Together, these utilities are known as the “HECO Companies,” and their rates track similarly to each other.
One noticeable change that occurred to the energy rates in the past 10 years was a shift in the cost recovery structure from high base rates and low adjustments to low base rates and high adjustments. This resulted in significant decreases in base rates with similar increases in the cost of adjustments as most of the cost-collection shifted to pass through charges like riders and adjustments that update every month and have steadily escalated over the years.
Now let’s go island by island and look at how the base and effective rates (effective rates being the base rates plus all adjustments) have changed over the last 10 years.
Hawaiian Electric Company — Oahu
Oahu experienced three base rate updates that occurred in 2012, 2018, and 2019. Each update resulted in decreases to the base energy rates; however, these decreases were offset by increases to the costs of adjustments, especially in 2019, which is demonstrated further in Figure 2.
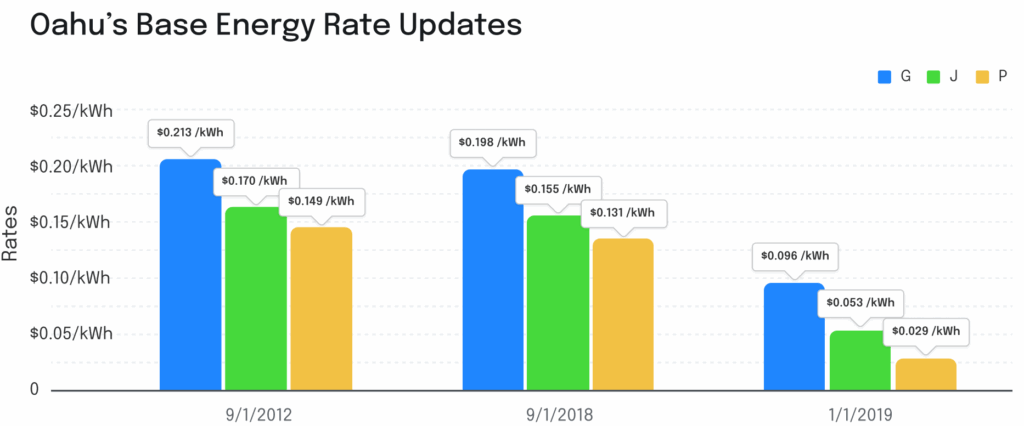
Figure 1: Updates to Oahu’s base energy rates, showing a significant reduction in 2019.
If you compare the base rate decrease of 2019 above with the average effective rate in year 2019 from the following table, you’ll see that despite the decrease in base rates, the average effective energy rate remained virtually the same due to a simultaneous increase in the cost of adjustments.
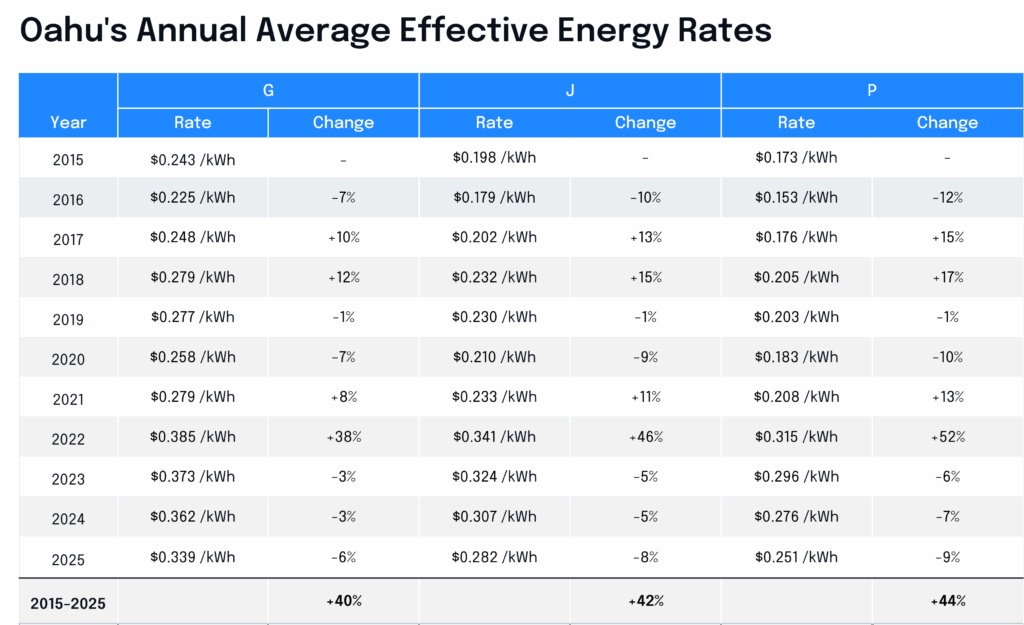
Figure 2: Average effective rates spiked in 2022 and have remained elevated since then.
A timeline of the annual average effective rates helps visualize the trends the rates have followed and the spike in 2022.
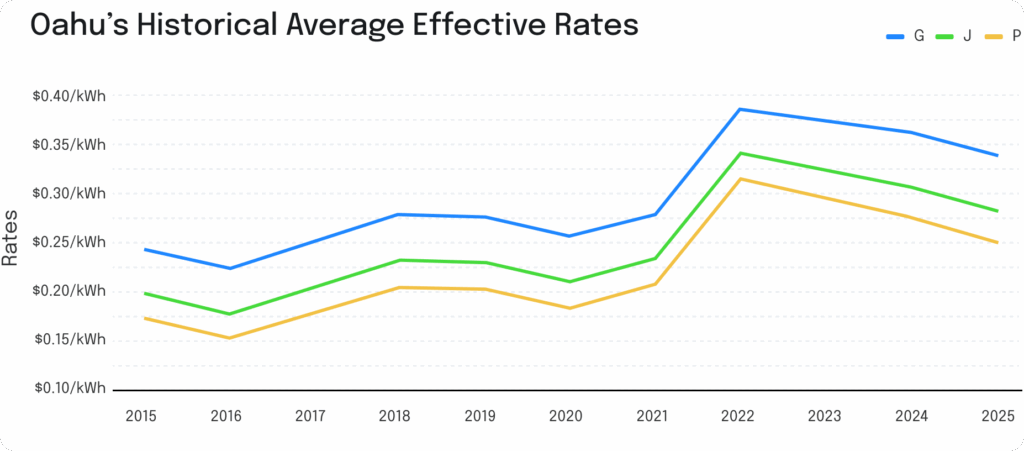
Figure 3: The average effective rates have trended downwards since the 2022 spike but remain elevated by an average of 21% from their pre-2022 levels.
Hawaii Electric Light Company — Big Island
The island of Hawaii experienced four base rate updates that occurred in 2012, 2018, 2019, and 2020. Each update resulted in decreases to the base energy rates, except for the 2020 update which had minor changes. Similarly to Oahu, decreases to the base energy rates were combined with increases to the cost of adjustments to keep the effective rates around the same level, if not higher in some cases.
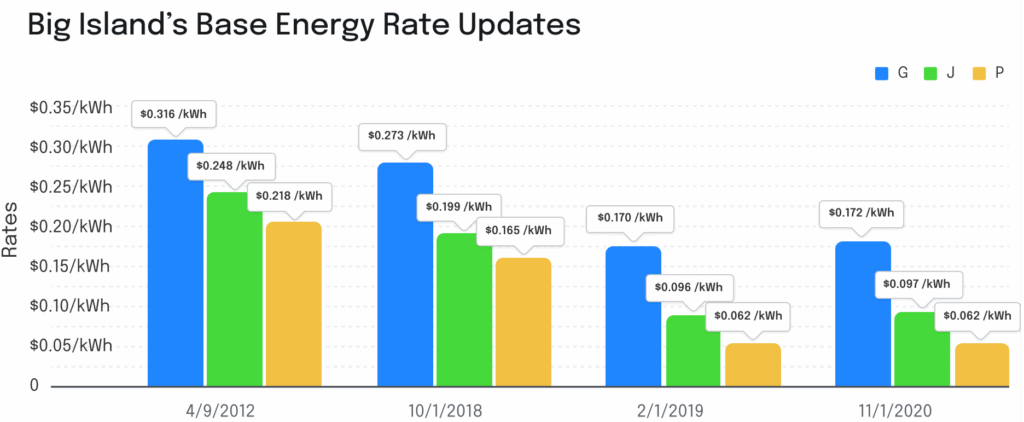
Figure 4: The first three updates resulted in decreases to base rates with the fourth showing minimal changes.
The annual average effective rates for the Big Island show similar trends to Oahu—periodic updates with significant increases followed by minor decreases in subsequent years.
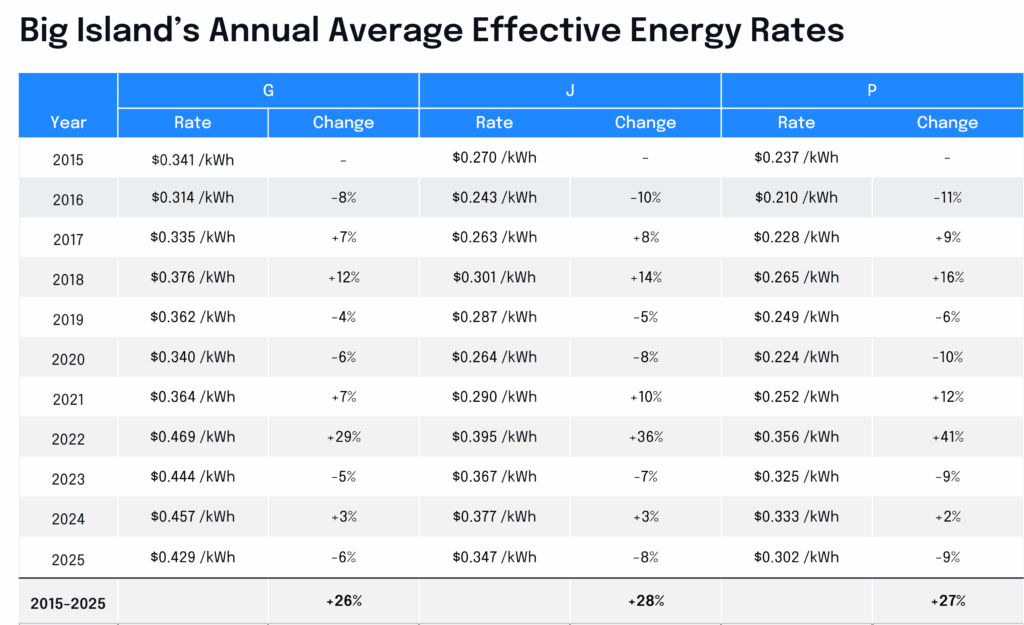
Figure 5: The overall rates are higher on the Big Island, but the 2015 to 2025 percent changes are the lowest of the three islands.
A timeline of the annual average effective rates shows similar trends as Oahu.
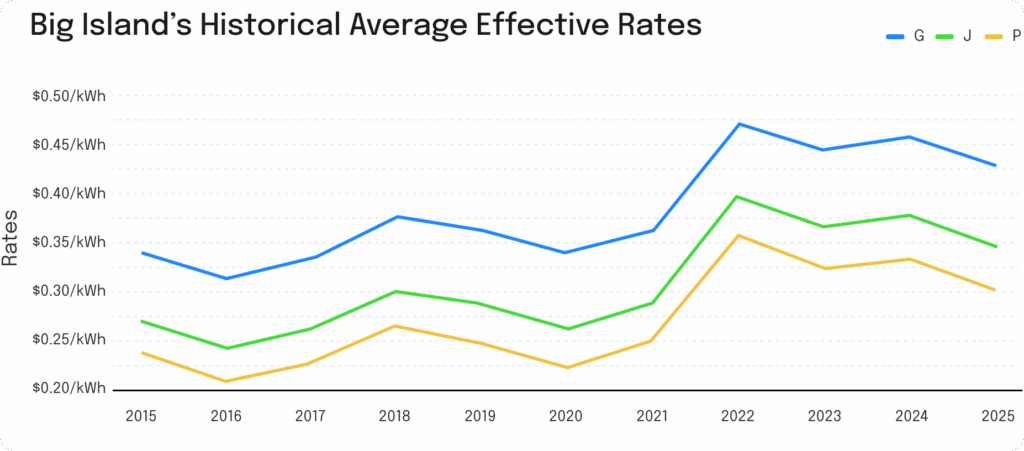
Figure 6: The current average effective rates are still up 19% from their pre-2022 levels.
Maui Electric Company — Maui
The last three base rate updates for Maui occurred in 2013 with two updates in 2019. All three updates came with decreases to base rates with the last update being the most significant.
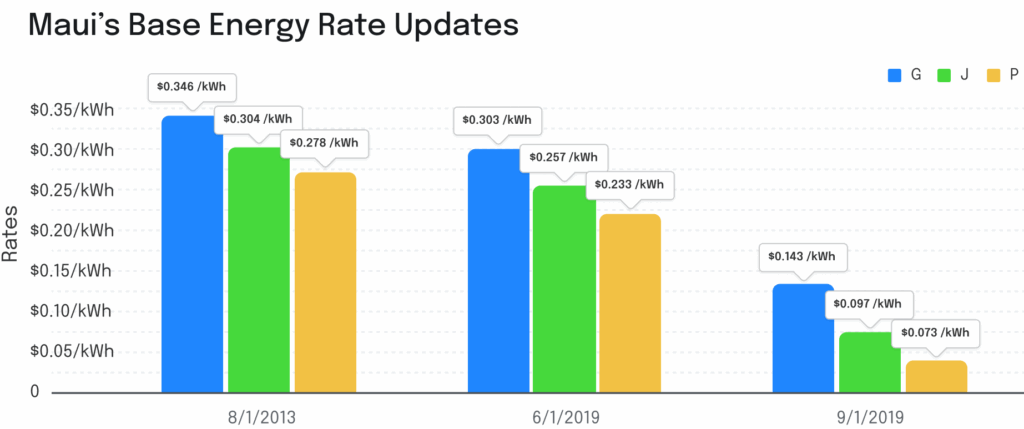
Figure 7: The second update served as a brief transition to the most recent update in September 2019 which is still in effect.
The annual average effective rates for Maui trend similarly to the other two islands, and the overall percentage changes for the average effective rates from 2015 to 2025 are over 30% for all three rate schedules.
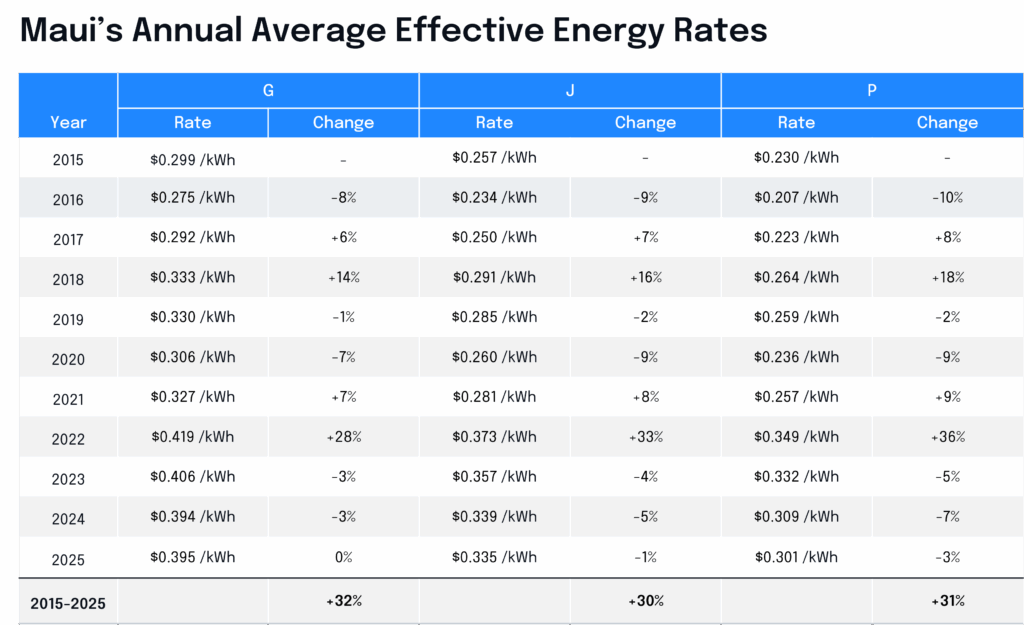
Figure 8: Maui customers experienced the second highest percentage change for their average effective rates in the past 10 years.
Once again, we see nearly the exact same trend over time as the other two islands.
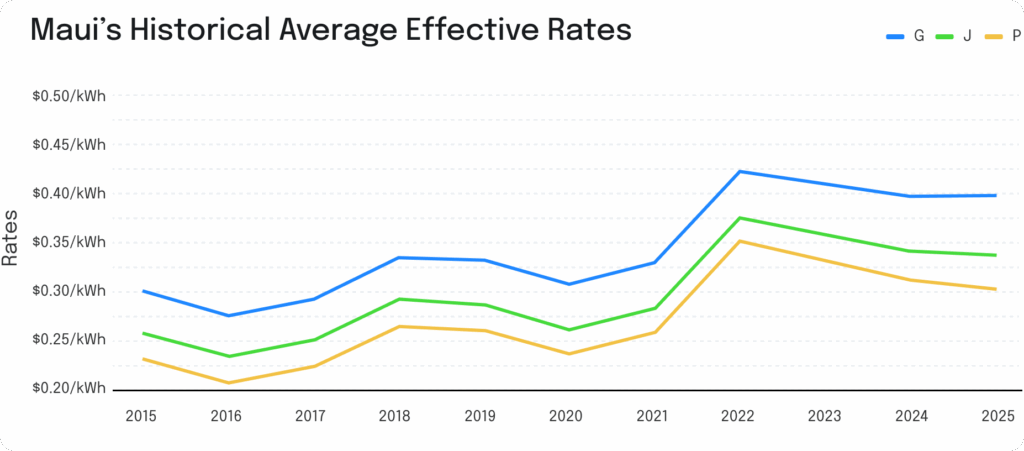
Figure 9: Despite the recent downward trend, overall effective rates are still up 19% on average compared to 2021.
Looking Ahead to 2026
It’s been over five years since the last base rate updates occurred for all three utilities. A new base rate increase is currently in the works for 2026 with HECO looking to recover more for infrastructure investments and wildfire mitigation-related costs. It remains to be seen what the exact impact will be; however, a base rate update on top of the rate adjustment costs that we’ve seen over the past 10 years suggests even further rate escalation.
There are opportunities to combat these rising electricity rate costs. Last year in 2024, HECO introduced its Shift & Save pilot that provided new time-of-use (TOU) hours and energy prices for participating customers to take advantage of. The program is now closed; however, the results from the program are being used to decide whether to introduce the program to all customers in the future. If reinstated, this program, when paired with the Bring Your Own Device Plus battery program, could provide potential opportunities for TOU arbitrage as well as financial incentives for installing storage to an existing solar system.
Our team of experts have worked on several large-scale storage projects in Hawaii that utilized our ETB Controller and ETB Monitor software to precisely manage battery storage operations and provide real-time insights. Also, with our in-house utility rates team keeping rate schedules for Hawaii up to date and maintained on a monthly basis, you can rely on our product suite at every step of the modeling, controlling, and monitoring process for your systems. Our consistent tracking of rates over the years enabled us to put this information together, and we hope it can be of use to empower and inform your solar and storage projects, developments, and analyses in Hawaii. Sign up for a 14-day free trial for ETB Developer and start modeling with the most accurate rate database on the market today.