


This is Part Three of our three-part series covering everything to know about utility bills, rate schedules, and the energy usage profile—all crucial components for modeling your solar and energy storage projects. In Part One, we covered the ins and outs of utility bills and their role in project planning. For Part Two, we dove into everything to do with utility rate schedules. This third and final part covers everything to know about the energy use profile (EUP) in ETB Developer.
What is the Energy Use Profile?
The EUP represents a site’s historical energy consumption data, typically aggregated from utility bills or interval data, and is used to simulate solar PV and energy storage performance. It essentially recreates an annual utility bill for a specific meter, capturing the customer’s consumption patterns. This profile is crucial for accurate energy savings calculations and avoided cost analysis when overlaying with solar generation and storage.
The EUP is the foundation for many features and functions in ETB Developer, including:
- Load Simulation
- The EUP accurately represents a site’s electric load over time by modeling solar generation versus load to determine self-consumption versus export scenarios.
- System Sizing & Optimization
- It informs proper sizing of PV arrays and storage systems to avoid overproduction or underperformance by matching the customer’s actual usage patterns and aligning system output with demand.
- Storage Dispatch Modeling
- The EUP is used to simulate battery behavior for strategies like peak shaving, energy arbitrage, or maximizing self-consumption.
- Energy Cost Analysis
- It can determine how much of a load is offset by solar, severed by storage, or pulled from the grid and helps quantify energy cost savings, bill reductions, and payback periods
- Comparative Scenario Analysis
- ETB Developer’s flexibility allows for side-by-side comparisons of different system configurations, utility rate schedules, and incentive programs using the same load profile to demonstrate ROI across different financial models within a proposal.
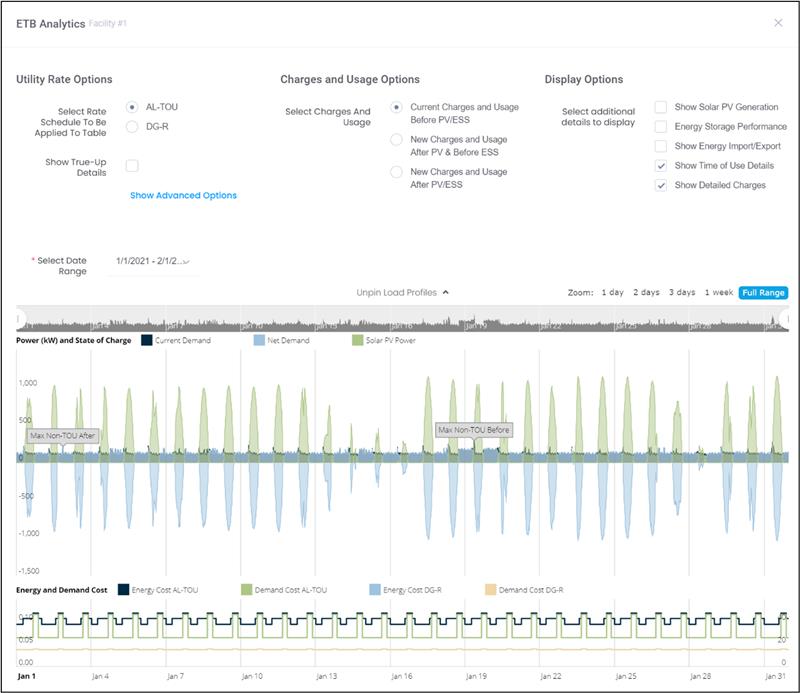
- ETB Analytics
- The EUP is the backbone for our ETB Analytics feature that provides monthly electric costs alongside demand profile visualization to provide granular insights into projects.
Energy Usage Data Options
Inputting energy consumption data is the next step in the process of creating an EUP after selecting a utility rate schedule in ETB Developer. Energy usage data is available in different forms, and we’ve designed ETB Developer so you can quickly and accurately input your customer’s usage data, regardless of the file format the data is in. We have several data input options available to choose from: monthly electricity bills, interval data, Green Button Data, and Utility API.
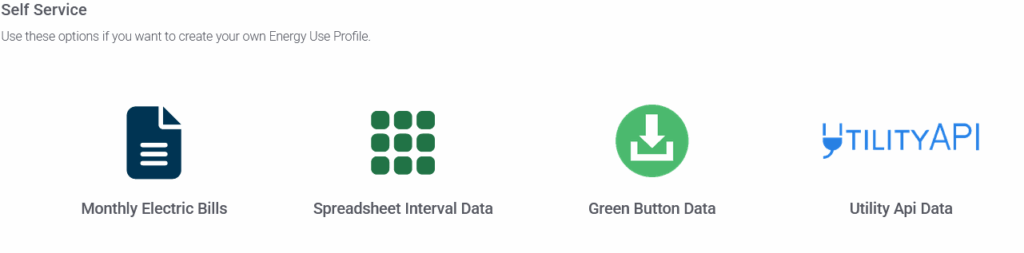
The monthly electric bills option allows you to manually input net energy usage (kWh) and demand (kW) for each billing period in a year.
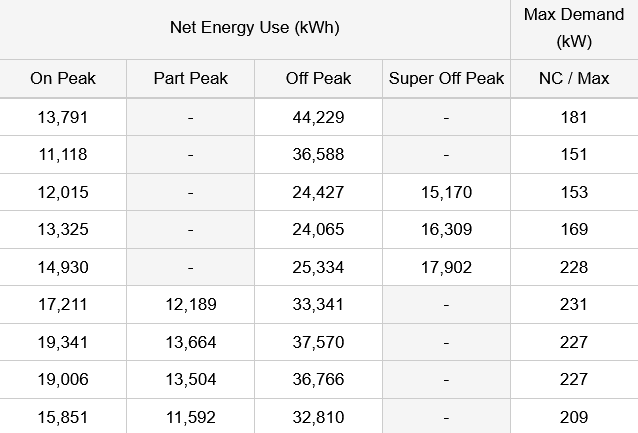
This option requires 12 months of bills. Bill consumption data isn’t as granular as interval data and provides no insight into when energy is used like interval data does, but we’ll further contrast these two options in the next section.
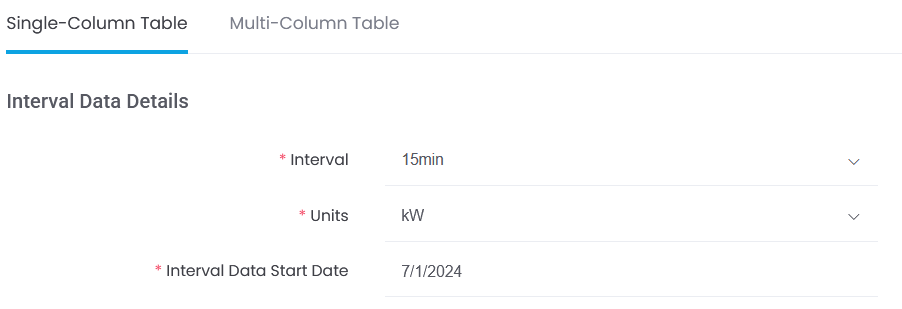
Interval data (also referred to as 8760 data) can easily be uploaded into the EUP with several options available for the different formats this data can be in. For example, interval data can come in single-column or multi-column tables; it can be in 15-, 30-, or 60- minute intervals; and it can be in several different units like kW, kWh, W, or Wh.
Interval data can also come in XML or CSV files imported from Green Button Data. If you have Green Button Data, you can easily upload both file types using this option.
Lastly, Utility API is one of our integration partners and requires a separate subscription. They will retrieve a customer’s data from the utility and place it in a Utility API account. Enter in your Token UID, and we can import that data directly into your EUP.
Bill Data vs. Interval Data
A common question we get has to do with which type of data is better to use—bill versus interval data. Let’s break down the pros and cons of working with each one.
Bill Data
- Pros
- Easily accessible and obtained from utilities
- Quick and simple analysis
- Fairly accurate estimates for customers on fixed-rate plans
- Cons
- Lacks granularity—cannot distinguish when energy is consumed, which makes it a poor fit for TOU, net billing, or demand charge modeling
- Inaccurate storage modeling—no information about peak demand turns storage modeling into guesswork
- System sizing can be over or under due to uniform monthly assumptions
Interval Data
- Pros
- Highly accurate for load profiling—energy is measured in 15-, 30-, or 60-min intervals giving a detailed model of when energy is used
- Improved TOU and net billing accuracy
- Supports accurate storage modeling and demand charge analysis—battery charge/discharge cycles and demand charge mitigation strategies can be optimized after identifying demand peaks
- Cons
- Data availability—not all customers have access to interval data since it requires a smart meter
Both sets of data can work, but getting your hands on interval data will unlock greater accuracy and potential for your projects. We recommend interval data along with 12 months of bills for the most accurate and complete picture of a customer’s energy usage and costs.
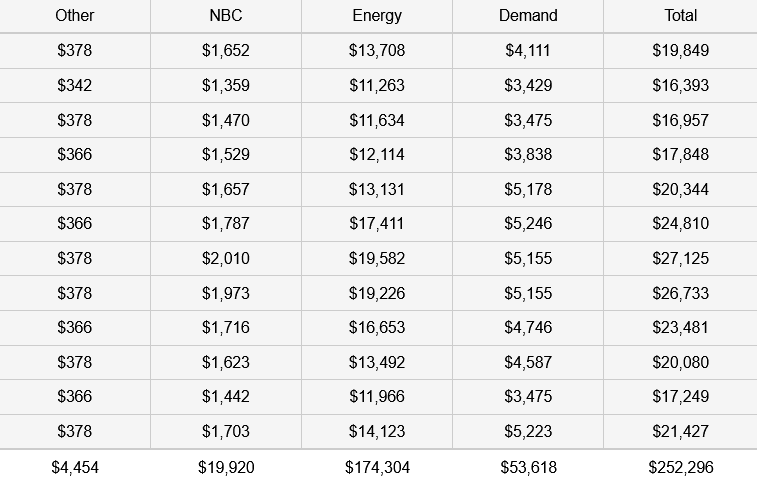
Bill Totals vs. ETB Developer Totals
Another common question we get regarding the EUP has to do with differences in ETB’s calculated bill totals compared to the actual bill totals. The totals calculated in the EUP use the charges from the utility rate schedule built in ETB Developer. If the totals in the EUP are different than your bills, that means either one of two things—either the bills are older and the utility rate in ETB is using more recent charges from the utility, or the bills are more recent and the ETB rate schedule is using charges that are no longer in effect. If the bills are older and the ETB rate schedule is using more recent charges, then the calculated bill totals in the EUP are more in line with how a customer is currently billed and how they are likely to be billed when projecting months into the future. On the other hand, if the bills are more recent than the ETB rate schedule’s effective date, then a simple update by our utility rate team should bring the totals closer together.
Other minor discrepancies can be caused by things like rounding in the EUP or incorrectly inputting energy usage into the EUP if manually doing so. Our in-house utility rates team is obsessed with accuracy, and so if you’re concerned about differences in your bill totals compared to the calculated totals in the EUP, then feel free to send a request to customercare@energytoolbase.com and they’d be happy to look things over for you.
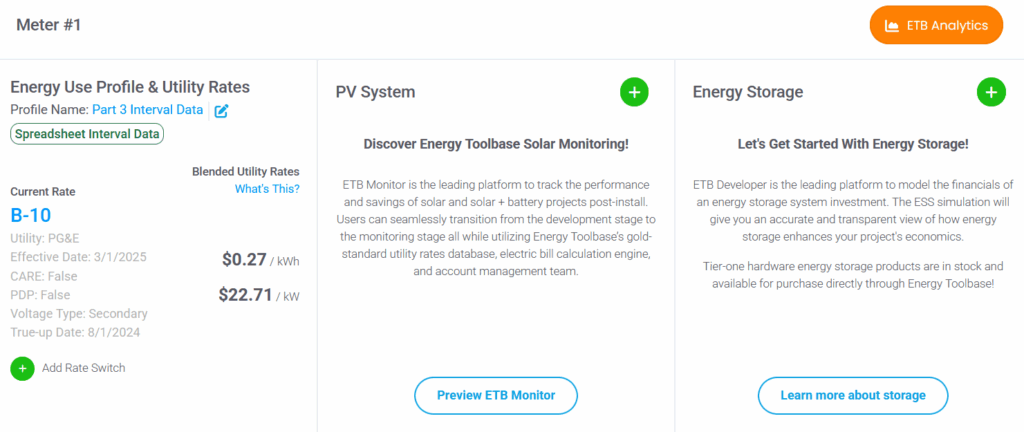
Once your rate schedule is selected and energy usage data is uploaded into your EUP, you can start modeling a rate switch, grid services, incentives and transactions, as well as solar and energy storage for your meter.
We made it incredibly intuitive and easy to model solar and energy storage projects in ETB Developer, and our ETB Monitor and ETB Controller with Acumen AI™ products bring your models to life with real-time monitoring software and energy management controls system. You can sign up for a 14-Day Free Trial for ETB Developer to start modeling your projects today!