


Welcome to this three-part series covering everything to know about utility bills, rate schedules, and the load profile—all crucial components for modeling your solar and energy storage projects.
If you’re in the business of solar or storage development, understanding electricity bills is essential for sizing systems correctly, modeling ROI, and making a persuasive case to customers. But utility bills can be dense, inconsistent, and full of industry jargon. So, let’s break down utility bills and highlight the key components to look out for.
Before diving into specifics, let’s look at why bills are such a valuable resource for planning projects. First, bills can give insight into a customer’s load profile, which shows how much electricity is used and helps size solar and energy storage systems properly. Second, bills can expose a utility’s billing structure. Time-of-use (TOU) rates, demand charges, special programs, riders, and fixed charges are some of the many line items that affect how much savings a potential renewable solution can deliver. Lastly, bills provide accurate baseline costs that serve as the foundation for projections and payback calculations. When decoding bills, you’re not just looking at total energy consumption—you’re also looking for clues that tell you how to design the best solar or storage system and make a compelling financial case. With that being said, let’s jump into it.
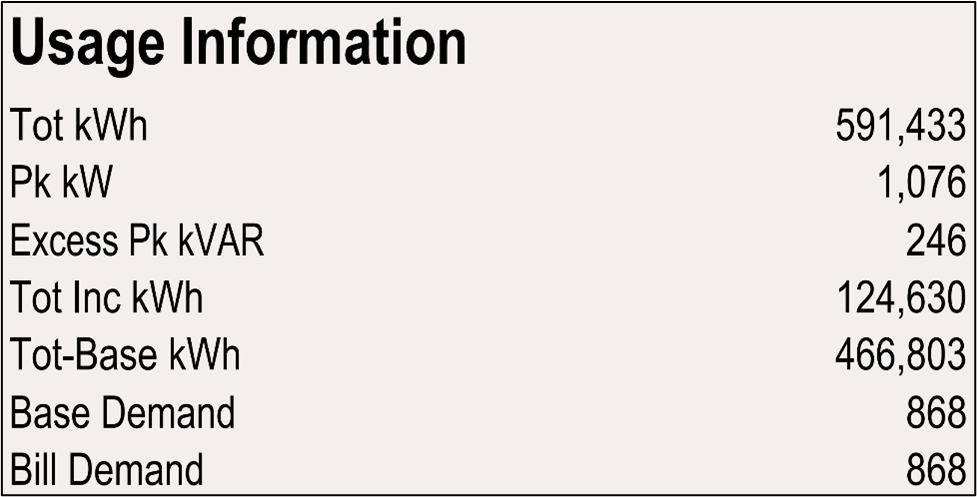
Meter & Usage Information
This section provides information recorded by a customer’s meter within a billing period like total kWh consumption, peak demand, TOU consumption, and other measurements that can be charted over the course of a year to create a customer’s load profile.
It’s important to note that using energy usage data from bills is not as accurate or detailed as having interval data because interval data provides a granular view into smaller intervals of time while bill usage only provides a monthly total. These small intervals, usually 15 minutes, can help identify specific times of peak demand that can be targeted for savings by an energy management system like our ETB Controller with Acumen AI™, which can also implement demand response programs and other energy efficiency strategies to capitalize on these specific intervals of time to maximize savings. We’ll touch more on load profiles and interval data in Part III of this series.
Rate Schedule
A rate schedule is a pricing plan or structure utilities use to bill customers. A bill may use the full rate schedule name as defined by a utility’s tariff sheet, or it may use a shorthand code, and is often found near the charges section of the bill. You can get a lot of information from a rate schedule’s name. For example, “TOU” in the name tells you that the customer is billed different energy prices at different hours of the day, which can indicate good opportunities for solar. Rate names with “G-,” “C-,” or “I-,” often indicate general, commercial, or industrial customers that are likely billed demand charges and could benefit from storage systems. And lastly, larger numbers in a rate schedule’s name often signal a larger customer classification, e.g., B-1 is a rate for customers with demands of 75 kW or less while B-19 is for demands of 500 kW or less.
Before even knowing the specifics of a rate schedule, you can start to get a good picture of the design opportunities from the name alone; however, looking up a rate schedule’s corresponding tariff sheet from the utility is the best way to understand how exactly a customer is billed. We’ll go into greater detail about rate schedules in Part II of this blog series.
Line Items
Line items are the charges billed to customers for their electricity service; these charges often fall into the following three categories: generation, transmission, and distribution. Generation charges, also known as supply, are used to cover costs associated with the production of electricity. Transmission charges pay for the high-voltage power infrastructure that delivers energy across long distances. Lastly, distribution charges cover the cost of the local power infrastructure like poles and transformers. It’s important to be able to recognize the different line items, explain them to customers, and identify which ones can be offset with solar and energy storage exports. Here are the types of charges you’ll find on bills:
- Fixed Charges
These are usually flat rate fees that cannot be offset with solar or storage. Fixed charges are also known as customer, service, monthly, or basic charges and can be billed monthly or daily. These charges are often tied to the monthly minimum bill that customers must pay for their electricity service.
- Energy Charges (kWh)
These are volumetric charges multiplied by a customer’s kWh consumption within the billing period and can vary in form from a flat rate to tiered or TOU pricing. Knowing a customer’s overall energy consumption is the base for offsetting with solar, and the $/kWh energy rate paid is important to know, especially for Net Metering customers who can receive the retail energy rate for their exported energy.

- Demand Charges (kW)
These are more common for commercial and industrial customers and are based on the highest power draw during a billing period, often in a 15-minute window. Battery storage is especially useful for customers struggling with high $/kW demand charges, as the storage system can help keep the customer’s peak demand under control.

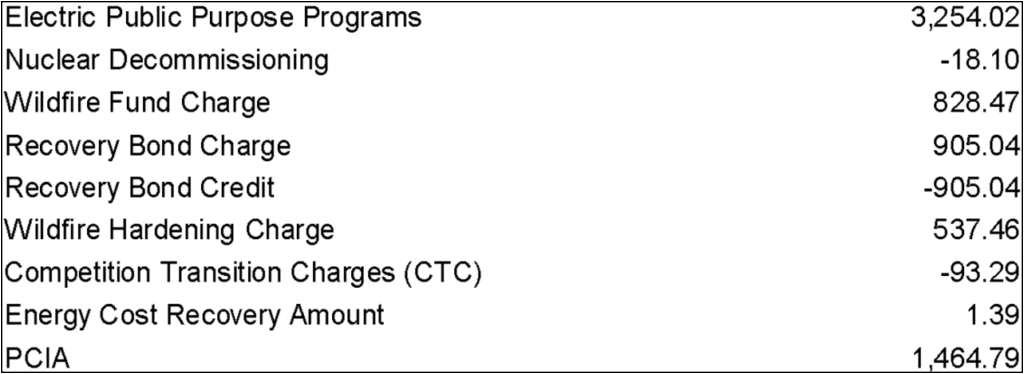
- Riders & Adjustments
Many utilities bill customers riders & adjustments to fund various programs like low-income assistance, storm protection, or wildfire hardening. These charges can be billed as fixed, energy, or demand charges and are included in a customer’s total energy rate.
- Taxes & Fees
Taxes are sometimes billed as $/kWh line items, or sometimes they’re applied as a percentage to the bill’s subtotal. In either case, you’ll want to account for any taxes or fees because they will affect estimated payback periods.
Energy Usage History
Most bills will have a chart of the customer’s electricity consumption, usually for the past 12 months.
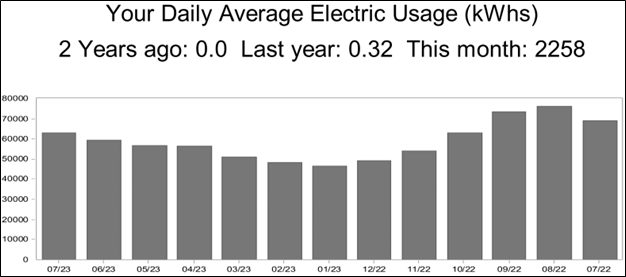
If the number of bills you have is limited, then you can use this information to fill in the gaps when analyzing a customer’s consumption. You can use these charts to look for usage trends, seasonal variations, and identify demand spikes. It’s essential to have a year-round picture of a customer’s consumption habits when designing a solar and energy storage model. Once again, it’s important to note that interval data will provide the most accurate picture of a customer’s energy consumption habits.
Third-Party Supplier Bills (Regulated vs. Deregulated)
Electricity bills can come in many shapes and sizes depending on the utility and type of service a customer receives. For example, customers residing in states with deregulated energy markets can pay a third-party supplier (TPS) for the supply portion of their electricity service while still paying their primary utility for the rest of their service. These markets can allow for different pricing plans and services for customers that they otherwise would receive from their utility.
Sometimes, the TPS charges and totals are included on a customer’s utility bill, while other times a customer receives two different sets of bills—one from their utility and one from their TPS. Take the following bill for example:
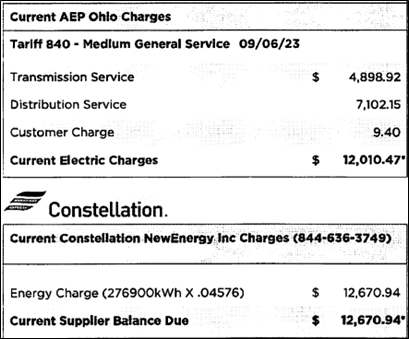
The customer is billed customer, transmission, and distribution charges from their utility, AEP Ohio, with no generation charge line item listed. That’s because Constellation, the TPS, is billing the customer at a different supply rate, which is included on the same bill. If the TPS charges were not present on the bill, then the absence of generation charges is a good indicator that the customer receives service from a TPS and is likely receiving two sets of bills, both of which you’ll want to have when running a financial analysis or preparing a proposal.
Understanding electricity bills and their different components is the first step to creating an accurate and comprehensive financial analysis for solar and energy storage. The next step is understanding the rate schedule, which is what we’ll cover next in Part II of this series.
Our ETB Developer platform makes the whole process of creating a financial analysis with bills, rate schedules, and load profiles incredibly simple. We precisely calculate utility costs, energy savings, and project economics in a transparent and defensible way. You can sign up for a 14-Day Free Trial for ETB Developer to start modeling your projects today!