

IMPORTANT MONTHLY UPDATES & ANNOUNCEMENTS
This quarter we’re highlighting the 833% increase in PJM’s capacity costs for 2025-2026, rate increases for Pennsylvania and Indiana customers, introducing two new members to our team, and covering our quarterly utility rate numbers.
PJM's 833% Capacity Cost Spike
Beginning June 2025, customers in PJM’s territory will experience significantly higher capacity costs. Capacity auctions that took place in June 2024 resulted in PJM Interconnection pricing 833% higher than the year prior. The overall impact for customers residing in states within PJM’s territory is likely to be 10-20% for residential customers and increases up to 29% for business customers.
Capacity costs, which are part of the generation charge, were significantly higher at auction because of a spike in demand due to population growth and development while supply is limited due to the retirement of old power plants. PJM has already committed to establishing a floor and cap for future capacity auctions to prevent spikes like this from occurring again; however, capacity costs for 2025-2026 are unaffected by these changes.
One way to avoid these coming charges is to opt for a fixed rate plan from a third-party supplier. These plans incorporate the incoming capacity costs, and you can lock them in for long-term contracts to shield yourself from inflation. ETB Developer makes it easy to model rate schedules with a third-party supplier using our Retail Supply Details feature in the Energy Use Profile.
Pennsylvania's Base Rate Increase
PJM’s capacity cost spikes aren’t the only increase Pennsylvania customers will feel this summer. The Pennsylvania Public Utilities Commission approved a $225 million base rate review submitted by FirstEnergy Pennsylvania Electric Company that expands low-income assistance programs and electric grid infrastructure investments. These rate increases went into effect April 2025, and residential customers of Met-Ed, Penelec, Penn Power, and West Penn were impacted in the following ways (assuming a typical customer using 1,000 kWh per month):
- Met-Ed – average increase of 1.9% or $3.49 for a new monthly bill of $191.19.
- Penelec – average increase of 4.1% or $8.33 for a new monthly bill of $209.29.
- Penn Power – average increase of 4.5% or $8.13 for a new monthly bill of $188.72.
- West Penn – average increase of 6.2% or $9.70 for a new monthly bill of $166.07.
Duke Energy Indiana's Two-Step Rate Increase
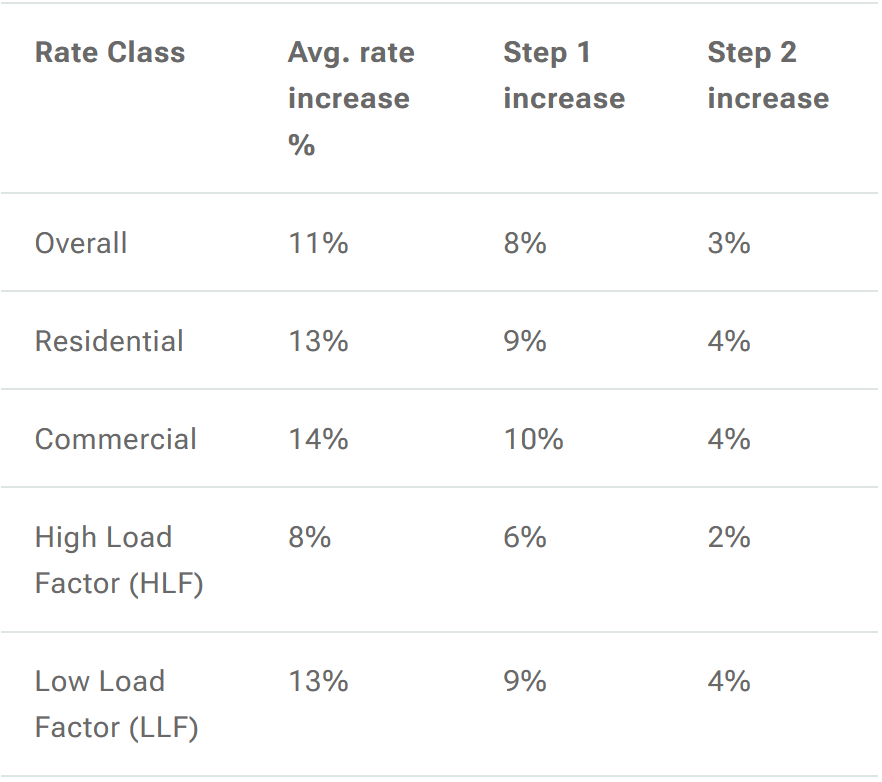
Duke Energy Indiana is another utility in PJM’s territory with rate increases that coincide with PJM’s higher capacity costs. Duke Energy Indiana is implementing a two-step rate increase with the first step in March and the second step in early 2026; the overall average bill impact of these increases will be 11%. The reasons for this increase are to construct more power lines, implement grid hardening and security measures, and improve grid resiliency. The impact on each rate class is as follows:
Duke Energy Indiana is also introducing optional time-of-use (TOU) rates for customers to voluntarily switch to as a method of combating these rate increases. These optional TOU rates are available for residential, commercial, and industrial customers, with peak hours occurring from 5 – 9 p.m., discount hours from 12 – 4 a.m., and all other hours being off-peak.
The introduction of these TOU rates is part of a growing trend we’ve seen as energy prices continue to increase across the country. These rates at least give customers the chance to shift their usage to lower-priced hours to curtail the effects of ever-increasing energy prices. TOU rates also give more opportunities for energy arbitrage with an energy storage system (ESS). Our ETB Controller with Acumen AI™ energy management system can take advantage of TOU pricing to maximize the value of any ESS to generate the highest revenue possible.
Our Growing Team
Every year, our utility rates team adds hundreds of new utilities and thousands of rate schedules that need to be maintained for our users. To help update this ever-growing database, we recently added two new members to the team—Kimberly Spence and Jeff Sontay! They are our newest Global Database Administrators and will make sure our rate schedules contain the most up-to-date information from utilities. Their addition to our close-knit and dedicated team brings us to a total of 11 members. We’re excited to have them join us as we continue to provide our users with the best ETB Developer experience possible.
Decoding Electricity Rates
We recently kicked off a new blog series, Decoding Electricity Rates, aimed at helping developers make sense of utility rate structures and their impact on solar and energy storage projects. Check out our blogs below:
Quarterly Numbers:
Our utility rates team enjoys sharing our progress with ETB users because much of it comes from user requests. Every utility and rate we add signifies expanding opportunities for solar and energy storage, and we think that is pretty neat! We quantify our successes from the previous quarter below:
- New global rates added: 187
- Updated global rates: 1100
- New utilities added: 22
- Unique States: 15 (Indiana, New York, Missouri, and more)
- Unique Countries: 3 (Liberia, Canada, and Trinidad & Tobago)
